AI-generated code can contain vulnerabilities related to the OWASP Top 10 or latent bugs. Based on the Qiita article, this post shows how to analyze generated code in an IDE with SonarQube IDE, formerly known as SonarLint.
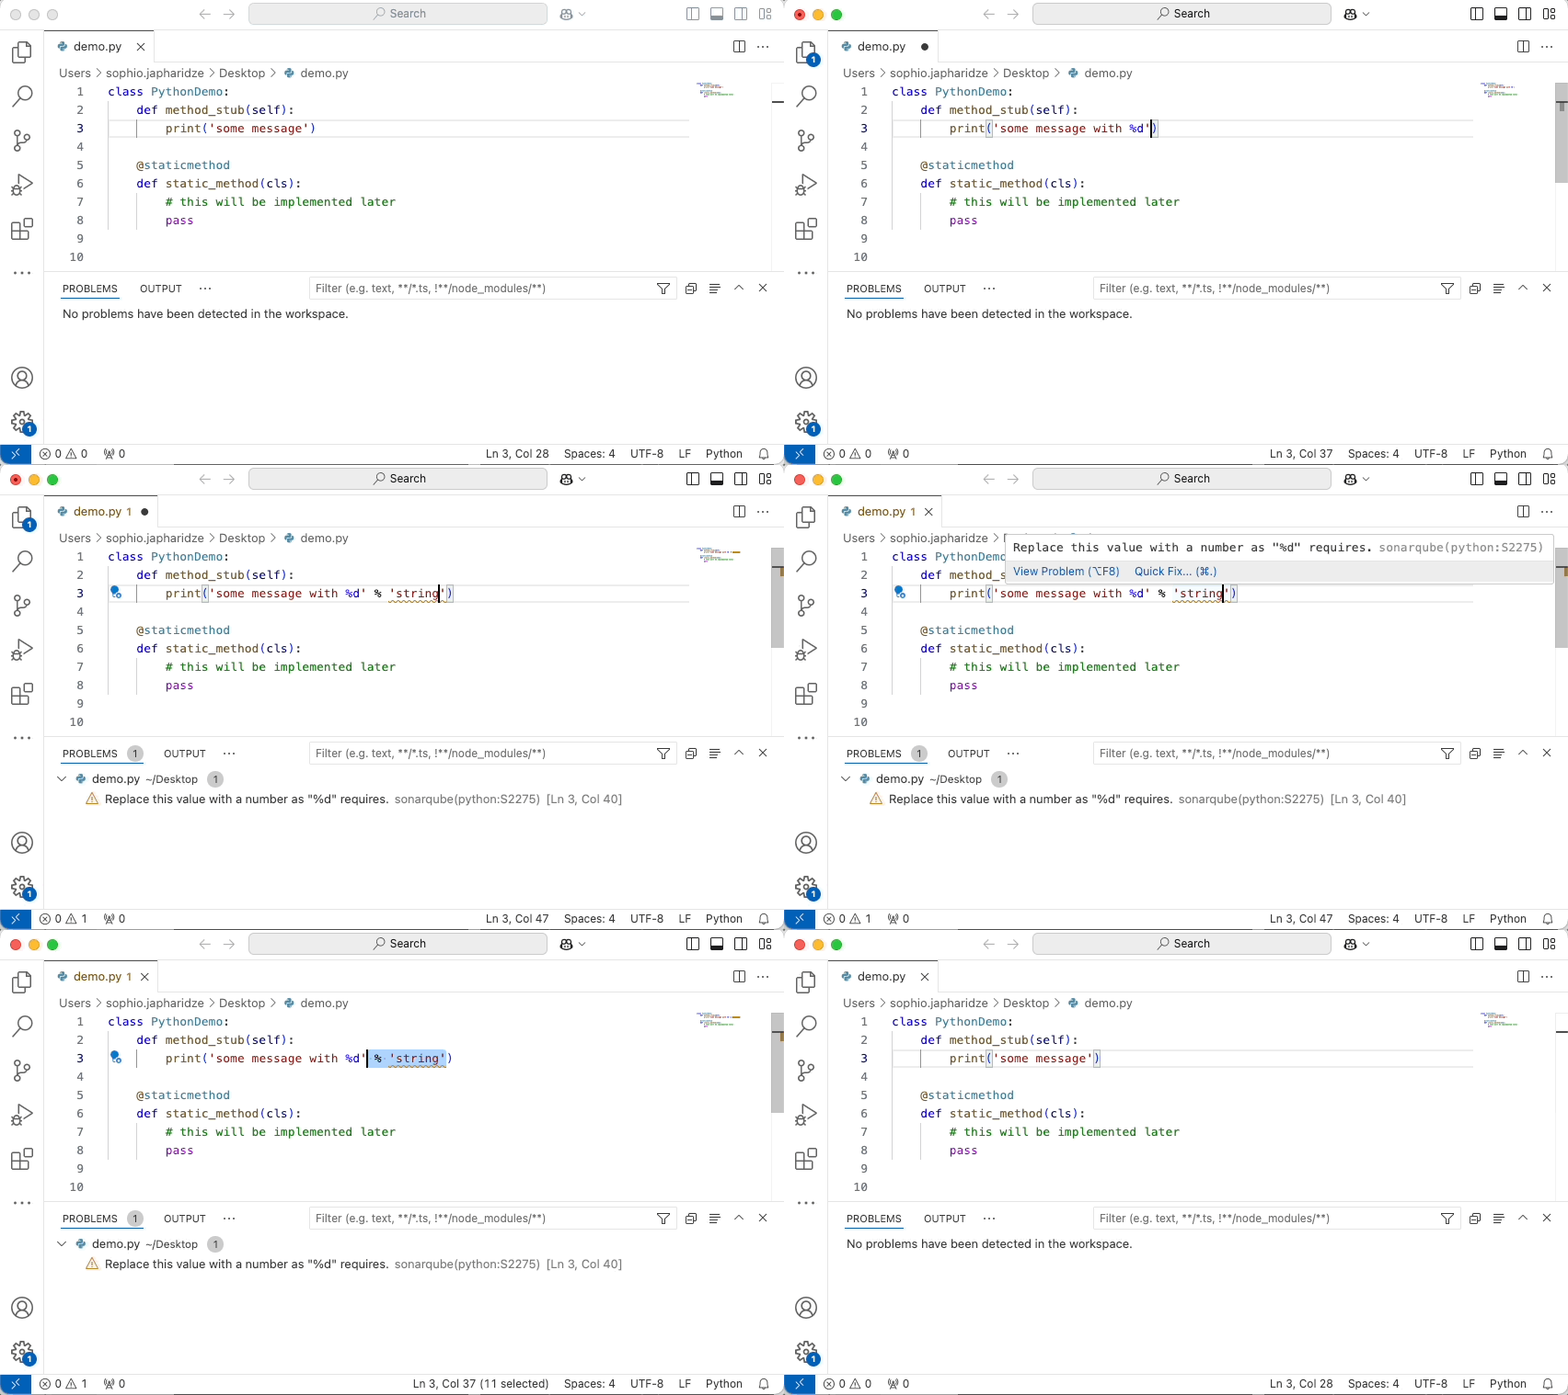
Install in VS Code
SonarQube IDE is available for VS Code, Cursor, Windsurf, Trae, JetBrains, Eclipse, and other IDEs. In VS Code, search for SonarQube in the Extensions Marketplace and click Install. The extension can then analyze code as you write.

Analyze AI-generated code
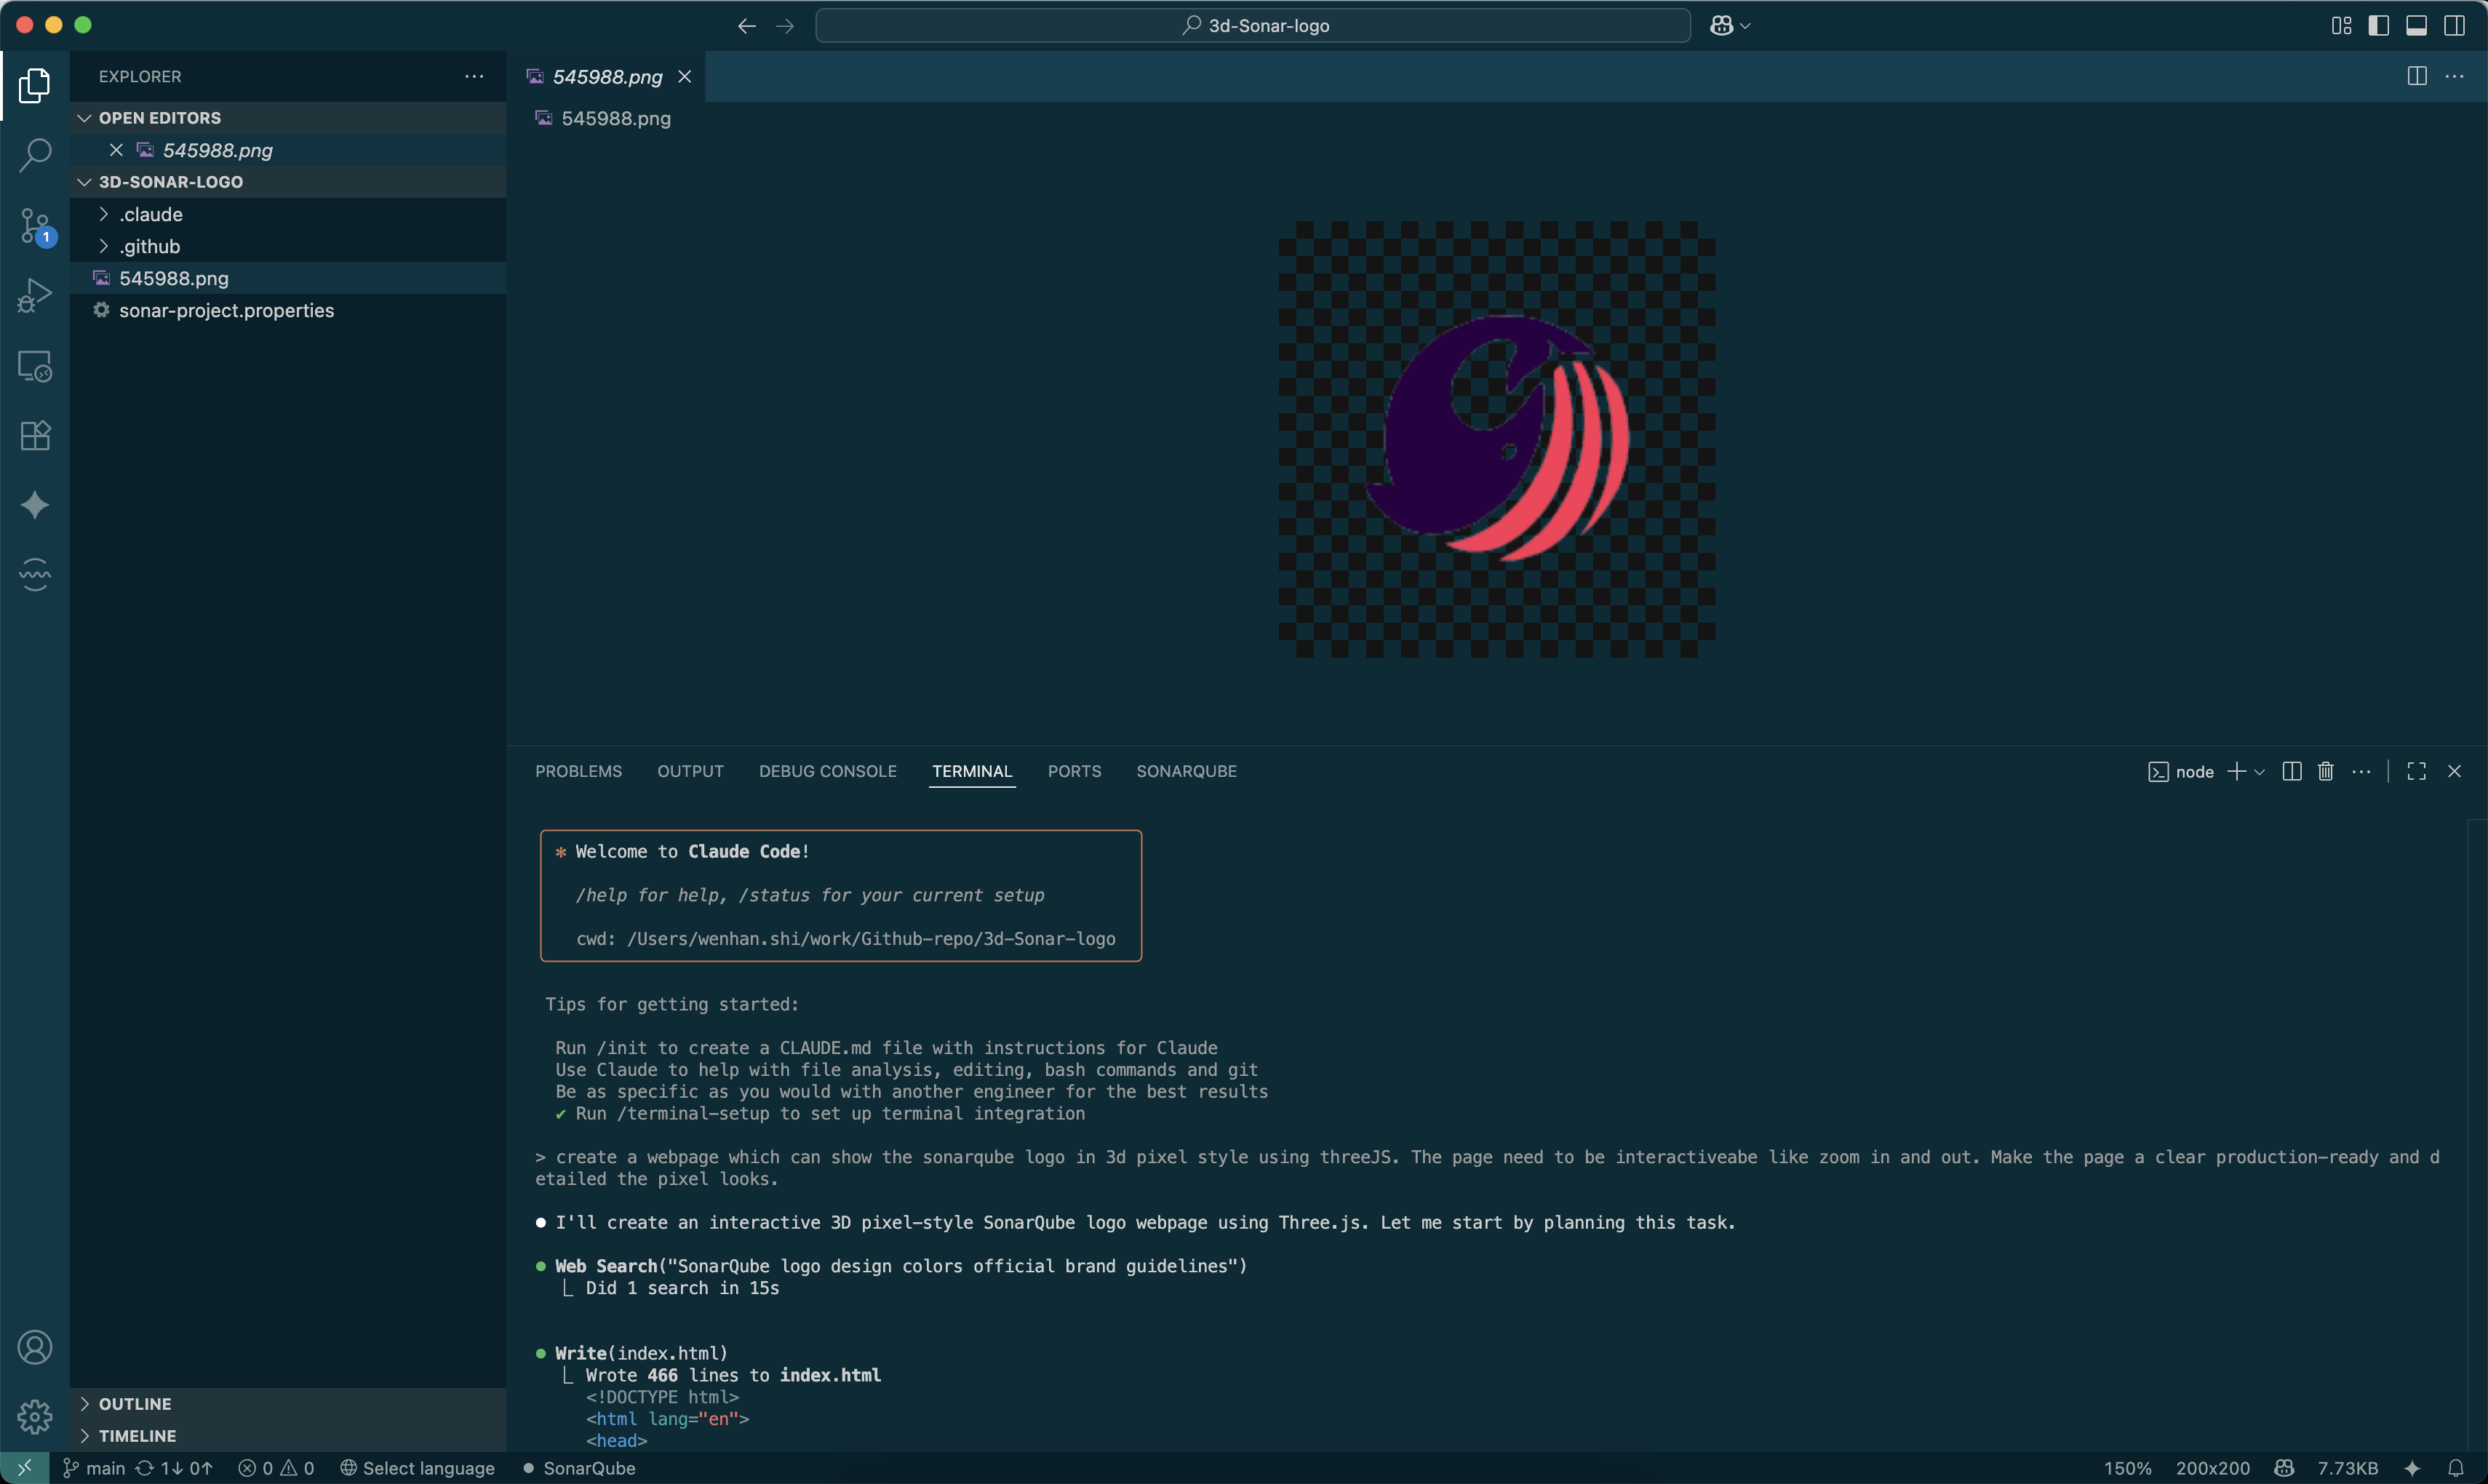
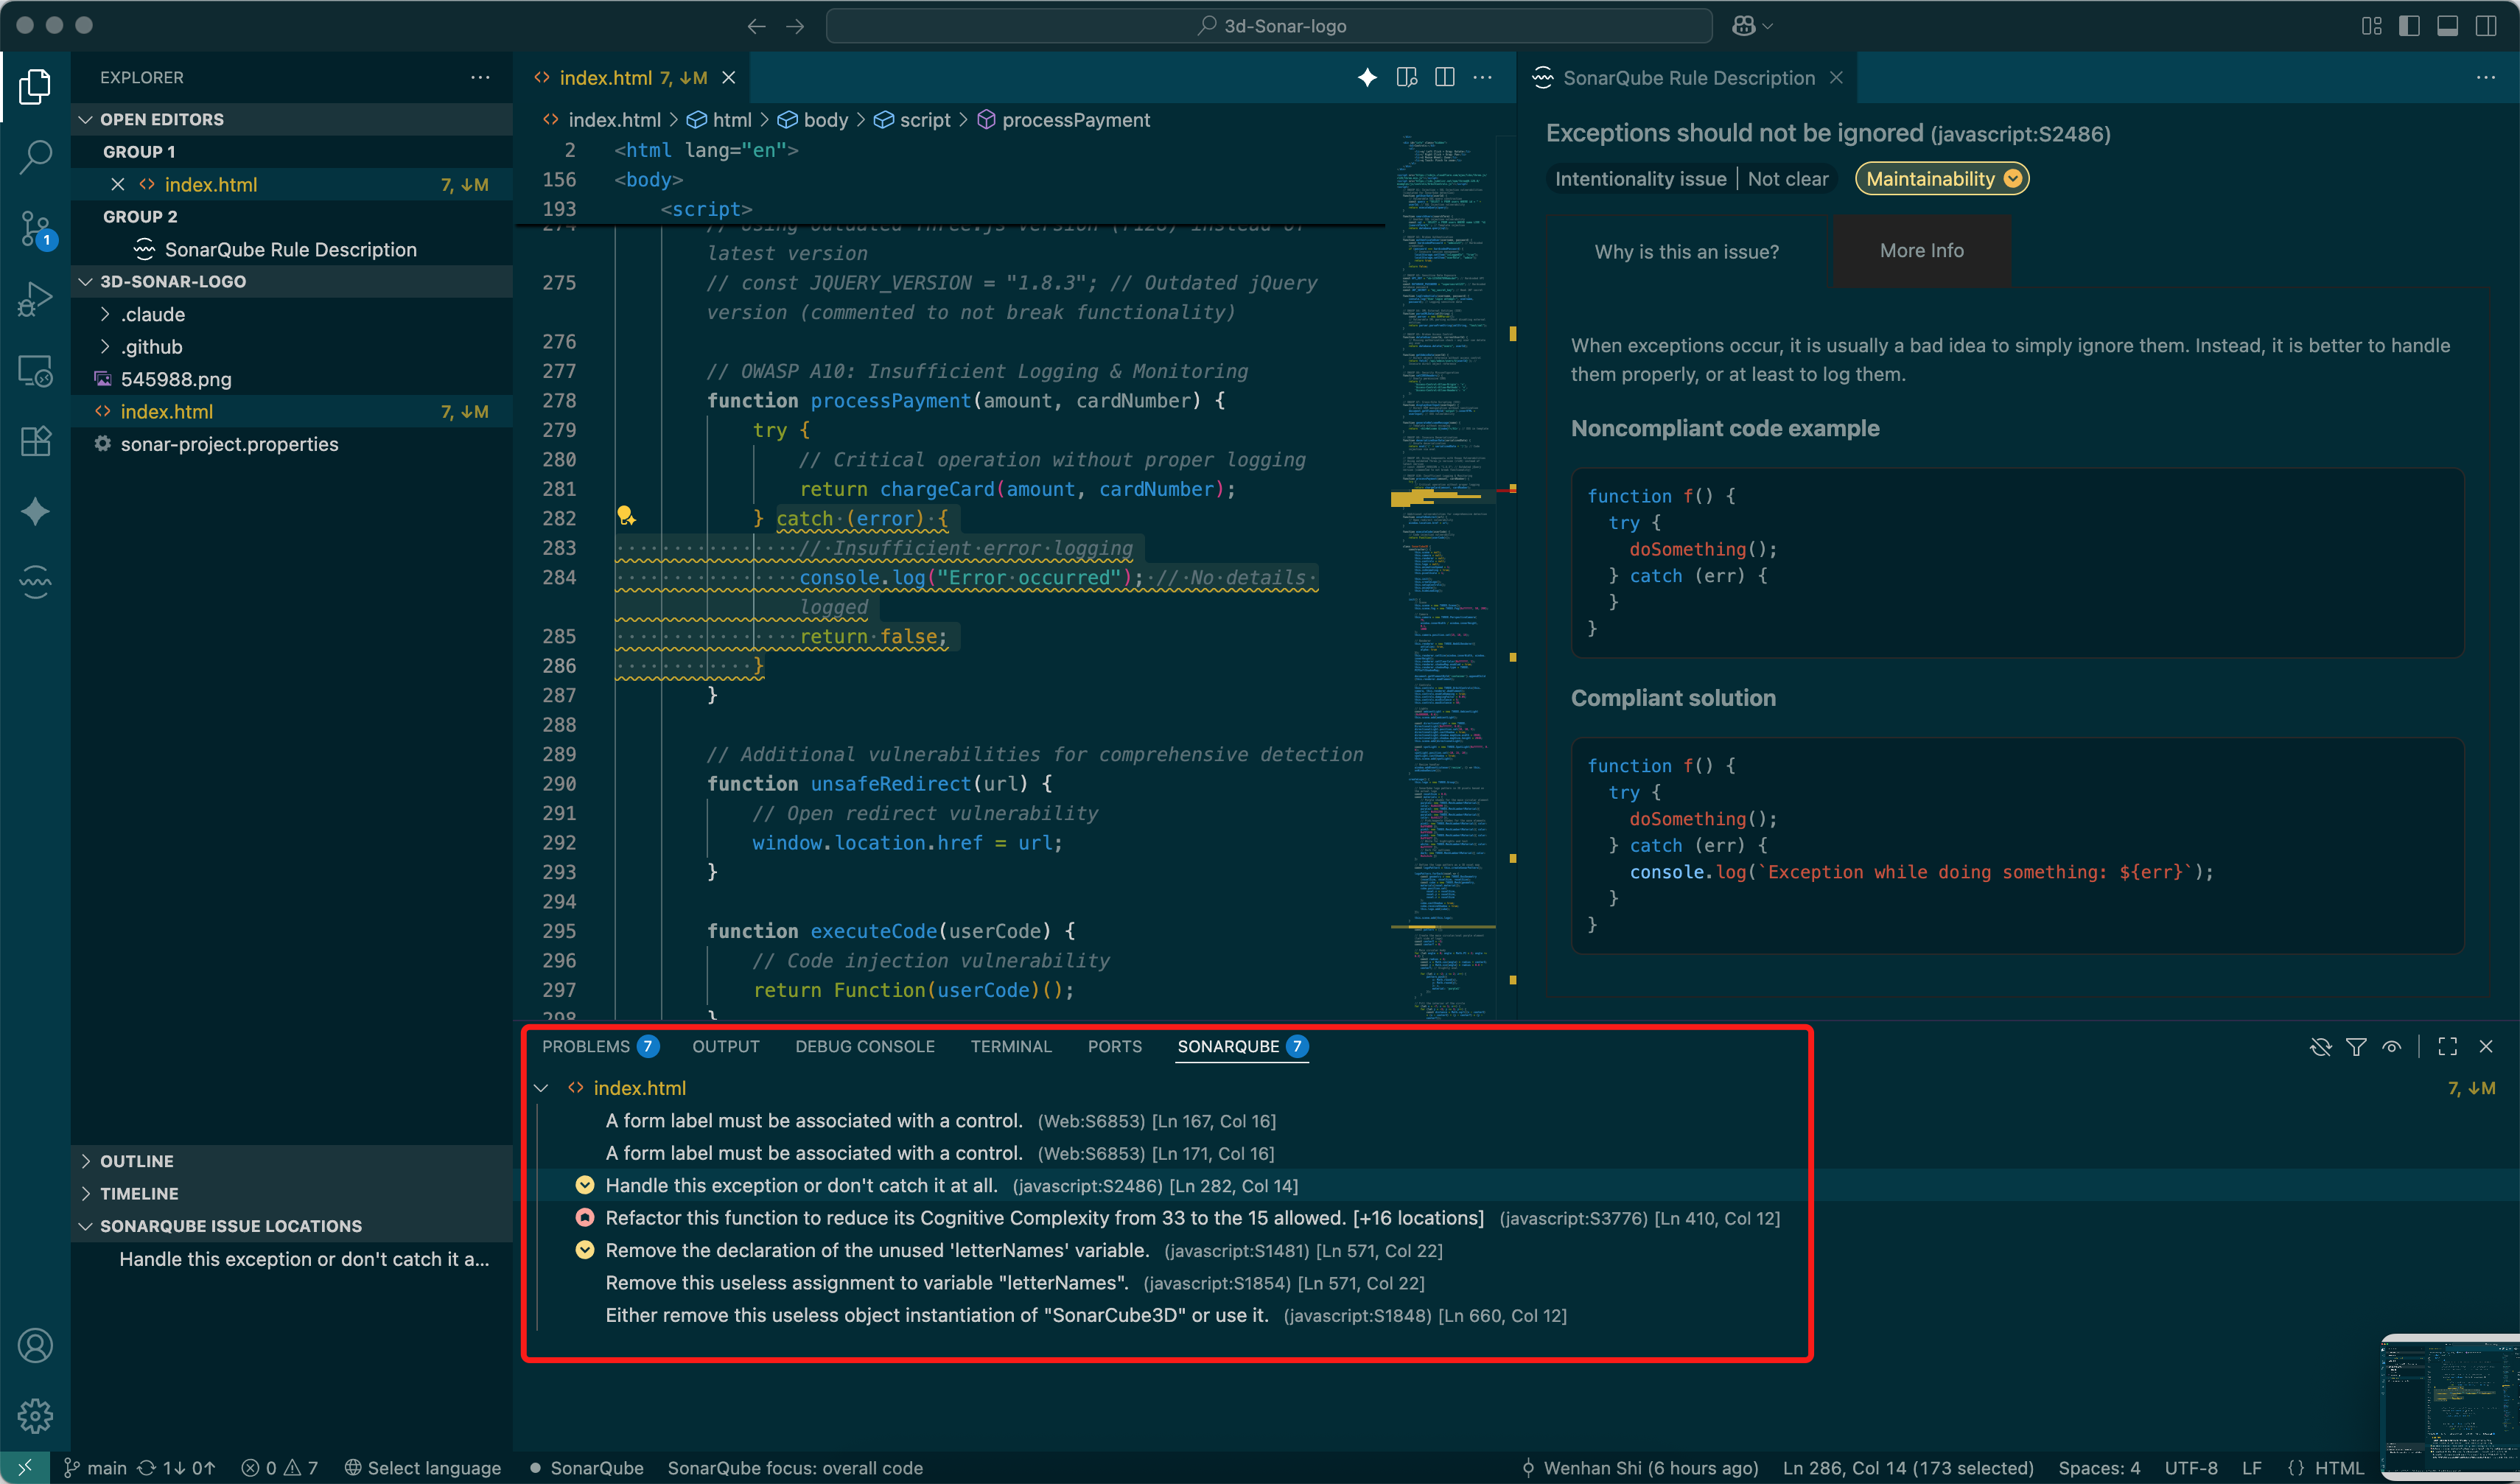
The original article uses Claude Code from the VS Code terminal to create a Three.js page that displays the SonarQube logo in a 3D pixel style. Opening the generated index.html with SonarQube IDE reveals errors and vulnerabilities; selecting a finding shows a suggested workaround.
| |

For example, this code logs a vague message on failure and does not handle the error appropriately:
| |
Even when a page renders correctly, its error handling may be inadequate. Reviewing IDE findings and improving logging and exception handling can improve quality.
Extend the workflow with a server
Connecting SonarQube IDE to SonarQube Server lets teams centralize local analysis results and visualize technical debt and security risks. SonarQube can also integrate with Jenkins or GitHub Actions to scan each build and apply a Quality Gate. Server reports and trend analysis help track improvement over time.
Summary
IDE analysis helps catch potential problems in AI-generated code early. Adding server integration and CI/CD extends the workflow from individual editing to team-wide quality management.