Based on the Qiita article, this post shows how to import a JaCoCo coverage report from a Maven Java project into SonarQube.
Get the sample project
| |
The project includes src/main/java/com/example/MyClass.java, src/test/java/com/example/MyClassTest.java, and a pom.xml configured for Maven and JaCoCo.
Generate the JaCoCo report
The JaCoCo Maven Plugin’s prepare-agent goal collects coverage data during tests, while the report goal produces an XML report. The original article uses this configuration:
| |
Run the tests and generate the report:
| |
The run creates binary coverage data at target/jacoco.exec and an XML report at target/site/jacoco/jacoco.xml.
Send the report to SonarQube
Specify the SonarQube URL, authentication token, and project key, then run the analysis:
| |
The log should show JaCoCo XML Report Importer and ANALYSIS SUCCESSFUL when the report is imported successfully.
Review the results in SonarQube
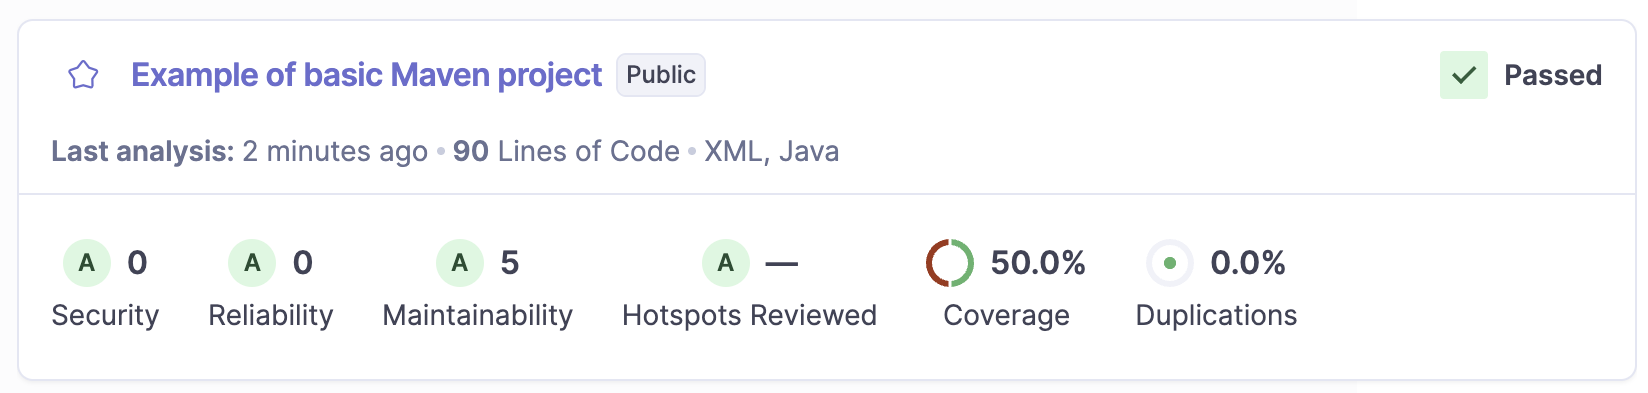
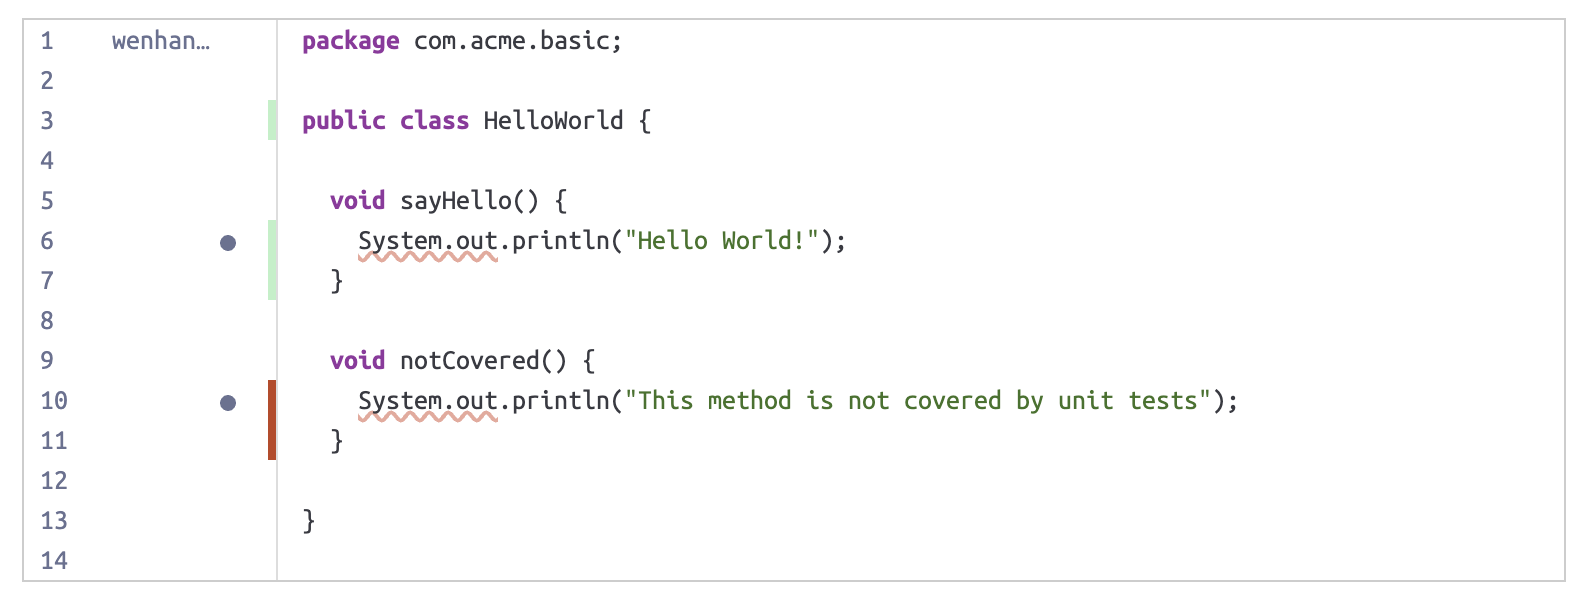
Check the project dashboard for coverage. The sample MyClass has coveredMethod() and uncoveredMethod(), but the test calls only the first method, resulting in 50% coverage. The code view highlights executed and unexecuted lines in different colors.
JaCoCo and Cobertura are options for Java; LCOV for JavaScript/TypeScript; Visual Studio Code Coverage and OpenCover for .NET; Coverage.py for Python; Clover XML for PHP; and the standard coverage format for Go. The common workflow is to generate a report and provide its path to SonarScanner.
Summary
Integrating JaCoCo with SonarQube makes test coverage visible in a CI/CD pipeline. Line-level highlighting helps identify code that is not covered by tests.